Does Sentiment, Expressed by Tweets, Have an Effect on Vaccination Coverage With COVID-19 Vaccinations?
An exploration of sentiment in tweets about vaccinations, and the possible effect on the amount of injections given during the COVID-19 pandemic

Project details
Project Requirements
- Gather and clean Twitter and vaccination data
- Perform sentiment analysis on the tweets
- Locate the tweets and visualize sentiment per country
- Perform linear regression to find a possible link between sentiments and vaccinations
Project Overview
The COVID-19 pandemic has been called the biggest crisis to hit our country after the second world war. Everybody is affected in some way and large portions of society came to a halt. Hospitals are overrun with infected patients, and regular care has to be postponed. The solution is to vaccinate most of the population, with a high enough coverage. Vaccination has proven to be a divisive issue with different opinions on either side however. Some are not willing to receive vaccinations while others can’t wait. When they share their sentiments with others, will this have an effect on the number of people that get the vaccine? Luckily for us data enthusiasts, this variety of opinions are made available by social media. Together with data about the amount of injections given, I try to answer the following question:
Is sentiment about COVID-19 vaccines, expressed in tweets, related to the amount of vaccinations given to people?
If the answer is yes, it means that Twitter might be used as a tool to monitor vaccination programs in an alternative way. It can also say something about our society. The most ideal outcome is a model that can predict the amount of vaccinations that we can expect in the future. If the answer is no, we’ll know that tweets can’t be used to gain more insight. To answer my question, I use two types of analysis. Sentiment analysis to determine if a tweet is positive or negative, and linear regression to calculate the relation between opinions and vaccinations.
The Data
I used open data from the Kaggle platform. After a quick review, I decided that this information can be trusted. Sources are well documented and can be reproduced. Two datasets were used:
Twitter data1 – The first dataset consists of tweets gathered from Twitter with the tweepy package. The names of the different vaccines and their respective pharmaceutical companies were used as keywords. My version of the data (22-06-2021) contains 107151 original tweets without any retweets. It lacks a reliable location, which I will add later. Tweets without any indication of location were removed and the texts were cleaned for further use in analyses.
Vaccination data2 - The second dataset has vaccination data per country and per date. It lists the amount of injections given. Although the data also contains information about first and second doses, I’m only interested in the amount of needles in arms. Dates without any vaccinations were removed.
I choose R as my programming language of choice to perform the analyses. It’s one of the most used tools for statistics, has access to a large amount of packages and has an active community. The practical component of the project can be divided in three parts. One for each type of analysis performed. Each has the goal to increase the value of the data from Kaggle. New information is gained and the original datasets are expanded and combined.
Sentiment analysis
This analysis quantifies the sentiment or opinions about vaccines. By giving each tweet a score, an opinion is now numeric. This is done by counting the amount of positive and negative words in a text. A lexicon is a list of words and their connotation, and is a central component in a sentiment analysis. Multiple lexicons exist and for this project I chose the version made by Bing Liu et al3. Every text, word for word, is compared with this list. A positive word increases the score by one, a negative word decreases the score by one.
The output is a score for each tweet in the data. It’s important to remember that sentiment scores are an approximation. To know ones exact opinion, we have to ask the Twitter user directly. The tweets where zero words matched the lexicon (and couldn’t be scored) were removed.
Locating tweets
To link sentiment in tweets to the vaccination data, we need a country of origin. Every Twitter user can provide their own location when signing up. This makes the location variable quite chaotic. Some users prefer not to give a location at all, and some provide nonsensical whereabouts like “the moon” or “my basement”. Another problem lies with the different names for the same locations. For example, “Holland” and “The Netherlands” are practically the same. I need these to be uniform for further analyses, so I used the API of OpenStreetMap4. After removing all tweets without a location, I gave the rest to their servers. Each sincere location yields coordinates which can be converted to raw GEO data, containing the country of origin.
I now have sentiments over time and per country. With this new information I created a map of the World and member states of the European Union with the average sentiment about COVID-19 vaccines per country. You will notice that some regions have no data. These had to few tweets to give an average sentiment that represents the entire population in a justifiable manner. These will also not be used in the next analysis.
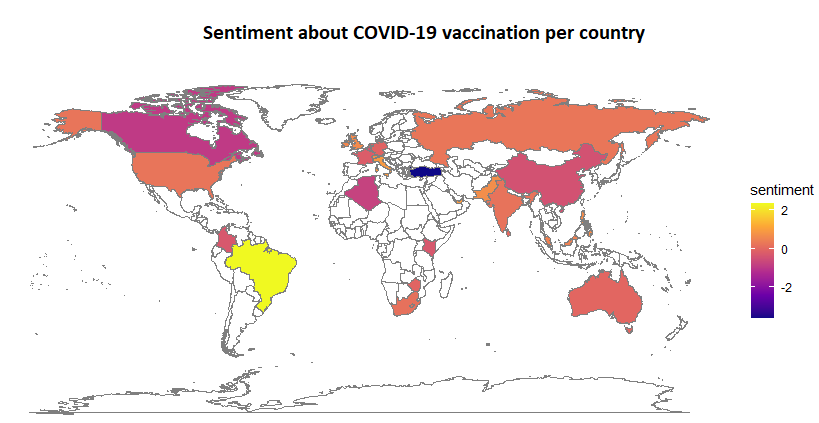
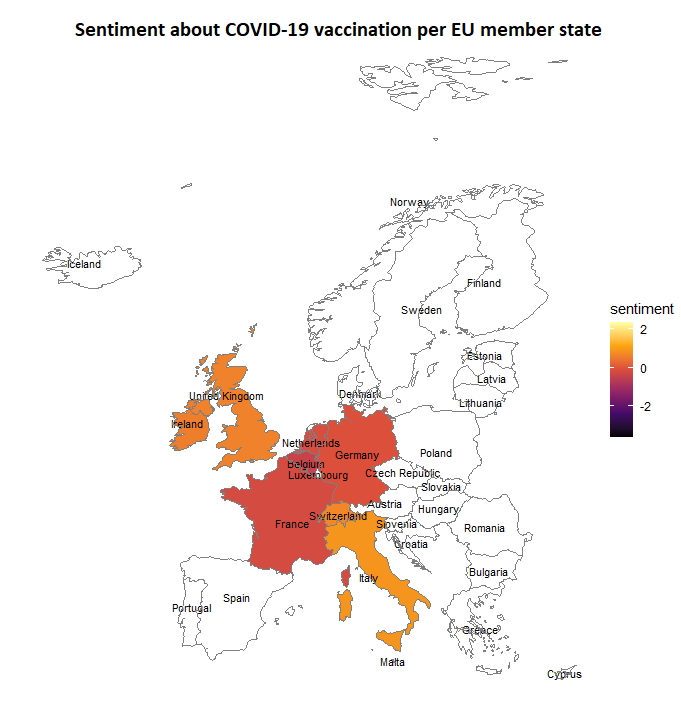
Brazil has on average the most positive views on the vaccine. This is somewhat surprising since the Brazilian president has been dismissive of vaccinations and the pandemic as a whole5. The country with the most negative opinions is Turkey. This is also surprising because the Turkish president is actively encouraging his people to get inoculated6. The efforts, or lack thereof, of an elected government aren’t automatically met with the same attitude apparently. When looking at the European Union, we can see that opinions don’t differ that much and is slightly on the negative side. The same sentiment is shared across neighbouring nations. The European country with the most positive outlook on the vaccines is Italy. This is not entirely surprising since it is was hit early and hard by the pandemic in Europe.
Before I continued with the next step, I combined the two datasets into a single one. Every date, per country, now also has data on the amount of vaccines given and the average sentiment for that specific country. This makes it easier to compare the different variables.
Linear Regression
With the final analysis I can answer the research question. Linear regression will compare the trends in sentiment with that in the amount of vaccinations given. The output is a model accompanied by descriptive parameters that indicate how well it performs. Ideally, you’d want a model that finds a strong effect of sentiment on the amount of data, and also fits well on the variation that’s present in the data. The quality can be assessed by looking at two parameters. The p-value indicates if an effect exists and how strong it is. Everything ≤ 0.005 is significant. The R-squared explains how much of the variation in the dataset is covered by the model, but is also a measure of its predictive capabilities. If this is 75% or higher, I will call it acceptable and accurate. The first model created was of low quality so optimization was performed. This gave the following output:
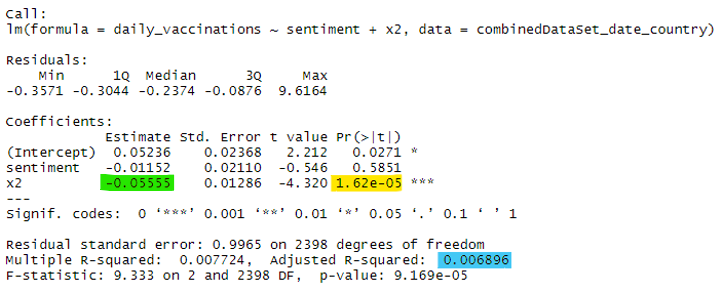
This is a bit abstract but I will explain the output with the color coded values. The p-value is 0.000016 and is therefore below the margin I explained earlier. This means that sentiment indeed has an effect on the amount of vaccines given to people. And even better, it’s statistically strong too! However, the model doesn’t explain all the variation in the data. The R-squared indicates that a mere 0.7% is covered by this model. This also means that sentiment can’t be used to predict the amount of vaccinations in the future. Another noteworthy variable is the estimate. This tells us in what happens to the sentiment if the vaccination value increases by 1. This estimate is somewhat negative which means that, when the amount of vaccine increases, the overall sentiment slightly declines.
Conclusions
To summarize: sentiment, express through Twitter, has a significant effect on the amount of vaccinations. I didn’t fully expected this result to be honest. Not every one gained access to a shot at the same time, and the production of the vaccines sometimes had to halted. Also, a significant portion of Twitter profiles are bots or trolls that try to manipulate opinions7. However, sentiment is not the variable to predict vaccinations further down the line. Other factors, like age or living conditions for example, might be better predictors. Sentiment alone isn’t enough to fully explain the complex issue of vaccinations for COVID-19. The fact that sentiment deceases when more vaccines are given says something about our society. The reason for this phenomenon is up for discussion. It’s my personal opinion that this value indicates the increasing dichotomy between proponents and opponents of the vaccine. Un-vaccinated people might feel more pressure as restrictions are lifted for their inoculated peers, and express this feeling or opinion more often.
Points for further research
- Compare lexicons and for different languages besides English
- Using more data by having more keywords to collect Tweets
- Compare more parameters besides sentiment
Sources
The R code I made can be found on this GitHub repository
- COVID-19 All Vaccines - Tweets Tweets about all COVID-19 Vaccines, Gabriel Preda
- COVID-19 World Vaccination Progress - Daily and Total Vaccination for COVID-19 in the World from Our World in Data, Gabriel Preda
- Bing Liu and collaborators Lexicon
- OpenStreetMap API Wiki
- Bolsonaro worked to shake Brazil’s faith in vaccines. But even his supporters are racing to get their shots, The Washington Post, 16-08-2021, Terrence McCoy and Gabriela Sá Pessoa
- Turkey's Erdogan receives COVID-19 vaccine, 14-01-2021, Reuters
- Researchers: Nearly Half Of Accounts Tweeting About Coronavirus Are Likely Bots, 20-05-2020, NPR, Bobby Allyn