Identifying Preferences in the Clientele of a Coffeehouse
Analyses of sales data from a local business to identify patterns in items sold.

Project details
Project Requirements
- Assess the state and structure of the data.
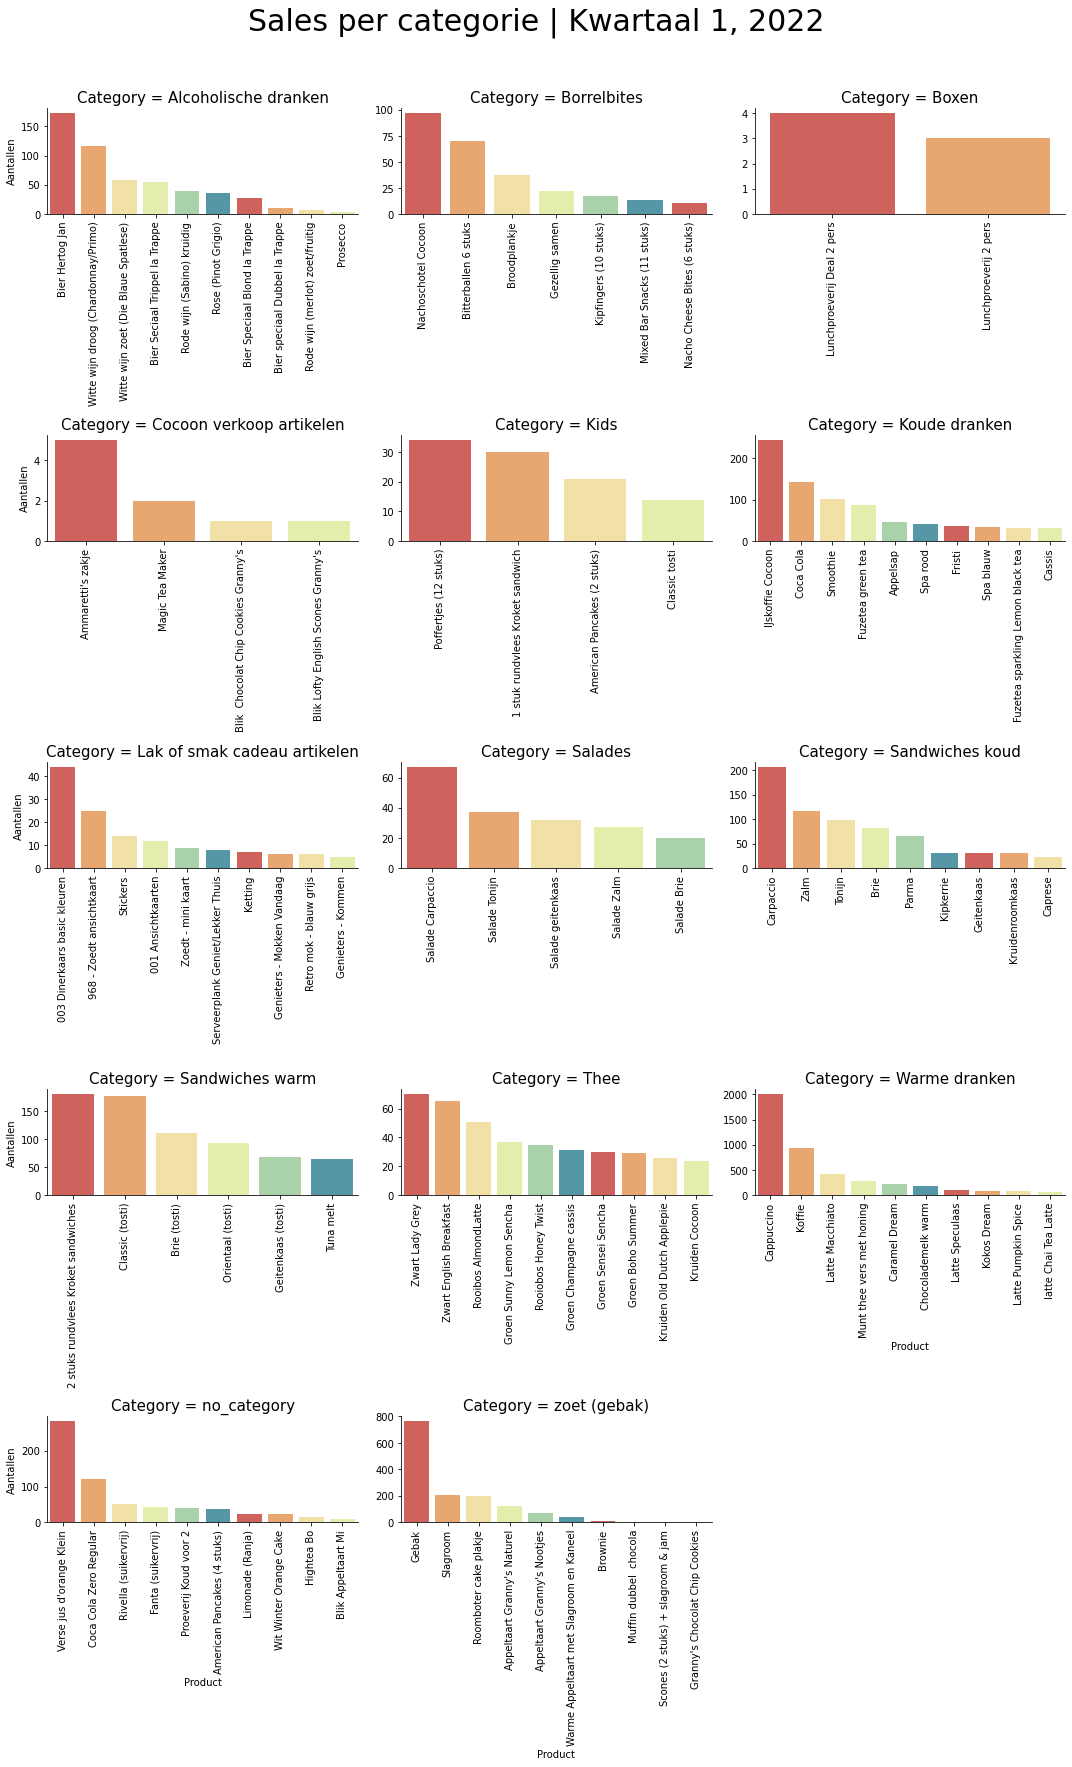
- Visualize sales per quarter, year and category.
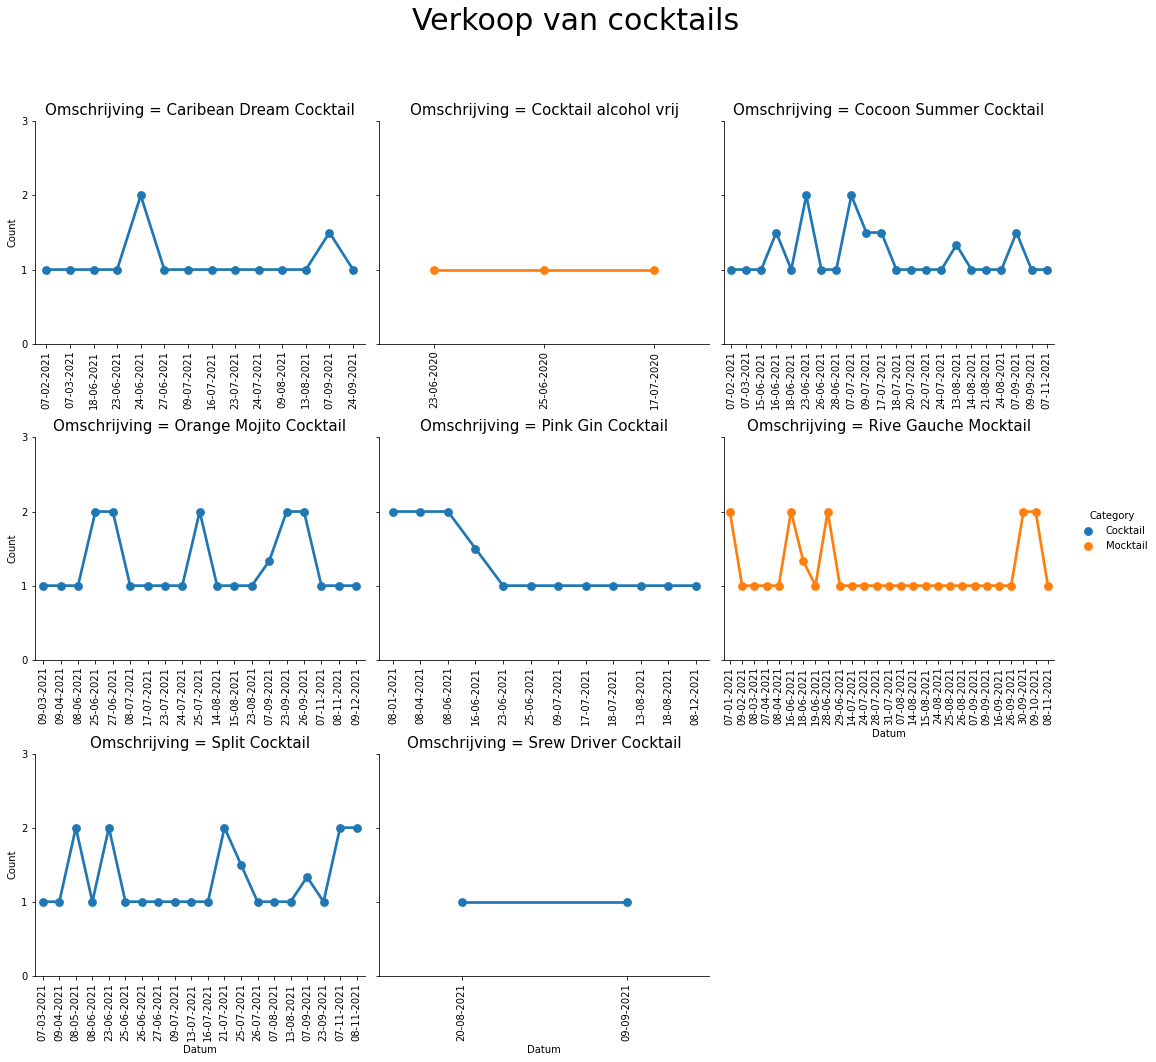
- Visualize cocktail sales in the summer of 2021.
- Perform a Market Basket Analysis.
- Present the results in a understandable and usable manner to the client.
Project Overview
The owner of Cocoon Coffee & More asked me to analyze sales since the company’s founding in 2019. The current cash register system provides only rudimentary insights, which often leave important questions unanswered. A more detailed analysis with Python could address these gaps. This project also served as an introduction to applying data practices in a smaller business environment. My task was to demonstrate the advantages of this approach and, above all, answer the client’s outstanding questions:
- What are the bestselling products per category, per quarter and per year?
- How well did the different cocktails sell in 2021?
- Which products are often bought together?
The Challenges
Some data wrangling was required before the analyses could be performed. The raw product names in the receipts were not suitable for immediate counting or analysis. They had to be standardized so Python could correctly interpret the items and quantities. Additionally, not all products were assigned a category: about 15.7% lacked one, which reduced the accuracy of the analysis. These items were given a placeholder label, and I recommended improving product annotation in the future.
A final challenge was presenting results in a way that was clear to the client. Technical terms needed to be explained without oversimplifying the insights. I documented the findings in a written report and accompanied them with a presentation, ensuring the client gained actionable insights about the business.
The Approach & Solution
The analyses were performed in Python, with each research question handled by a separate script. At this stage, the project serves as an introduction to data analysis for the client. More permanent solutions can be considered later.
- Data preparation and visualization were done using Python libraries.
- Visualizations were created with the Seaborn library1.
- For quarterly sales, I used faceted grids2 with bar charts to display multiple categories clearly.
- For cocktail sales, I applied a time series visualization.
The Market Basket Analysis was carried out with the MLxtend3 library, using the apriori algorithm4. This method identifies association rules that reveal which items are frequently purchased together, along with the likelihood of co-purchases. Insights like these can help identify keystone products or guide product placement. The most prominent association rules are as follows.
| Association Rule | Support | Confidence | Lift |
|---|---|---|---|
| Cappuccino ⇒ Pastry | 0.088 | 0.240 | 1.271 |
| Pastry ⇒ Cappuccino | 0.088 | 0.467 | 1.271 |
| Coffee ⇒ Pastry | 0.056 | 0.238 | 1.259 |
| Pastry ⇒ Coffee | 0.056 | 0.296 | 1.259 |
| Coffee ⇒ Cappuccino | 0.087 | 0.372 | 1.014 |
| Cappuccino ⇒ Coffee | 0.087 | 0.238 | 1.014 |
The Results
The results were shared with the client through a printed report, an on-site presentation, and digital delivery of large graph files. The analysis revealed bestselling products and sales trends for seasonal items like cocktails. To illustrate this, the charts below show quarterly and yearly sales, as well as summer cocktail sales:
The Market Basket Analysis showed strong links between pastries and coffee/cappuccinos. The table below highlights some of the most relevant association rules, including support, confidence, and lift values:
| Association Rule | Support | Confidence | Lift |
|---|---|---|---|
| Cappuccino ⇒ Pastry | 0.088 | 0.240 | 1.271 |
| Pastry ⇒ Cappuccino | 0.088 | 0.467 | 1.271 |
| Coffee ⇒ Pastry | 0.056 | 0.238 | 1.259 |
| Pastry ⇒ Coffee | 0.056 | 0.296 | 1.259 |
| Coffee ⇒ Cappuccino | 0.087 | 0.372 | 1.014 |
| Cappuccino ⇒ Coffee | 0.087 | 0.238 | 1.014 |
In particular:
- Lift > 1 indicates a positive relationship between items.
- Support shows the percentage of transactions containing the combination.
- Confidence measures the proportion of transactions containing X that also contain Y.
These rules are valuable because they describe patterns in how customers actually behave when making purchases. For example, the rule “Pastry → Cappuccino” with high confidence indicates that customers who buy a pastry are also very likely to order a cappuccino. This kind of insight can be applied directly in practice:
- Product placement: By placing pastries close to the coffee machine or promoting them together, the café can encourage bundled purchases.
- Menu design: Highlighting combinations in the menu (e.g., “Coffee & Pastry Special”) can capitalize on natural buying behavior.
- Inventory planning: Knowing which items are often sold together helps with stock management and reduces the risk of running out of popular combinations.
- Upselling opportunities: Staff can be trained to recommend coffee when a pastry is ordered, or vice versa, making sales strategies data-driven rather than guesswork.